Hi-
I notice on all 3 of my new ASL3 nodes the memory usage goes up continuously over time until system is almost totally out of memory. (2x Pi4 and 1x Pi3). I have the metrics and history running on all 3 but I do not see a way to identify memory usage per service etc. I have looked on the services section as well.
Are you fully updated? How are you monitoring memory?
I have been fully updated but just checked and see there are new updates which I am installing now. I just rebooted all 3 and they are on ASL3 v3.0.1 per asl-menu but rollover in dashboard says 3.2.0-1.deb
I will monitor them again over the next 10 to 24 hours thx. As I mentioned I am using metrics and history screen in ASL3 dashboard to view usage. Pics are of all 3 and 2 are from 62028 showing RAM usage at boot and then later. (pics are pre updating to 3.2.0-1.deb today)
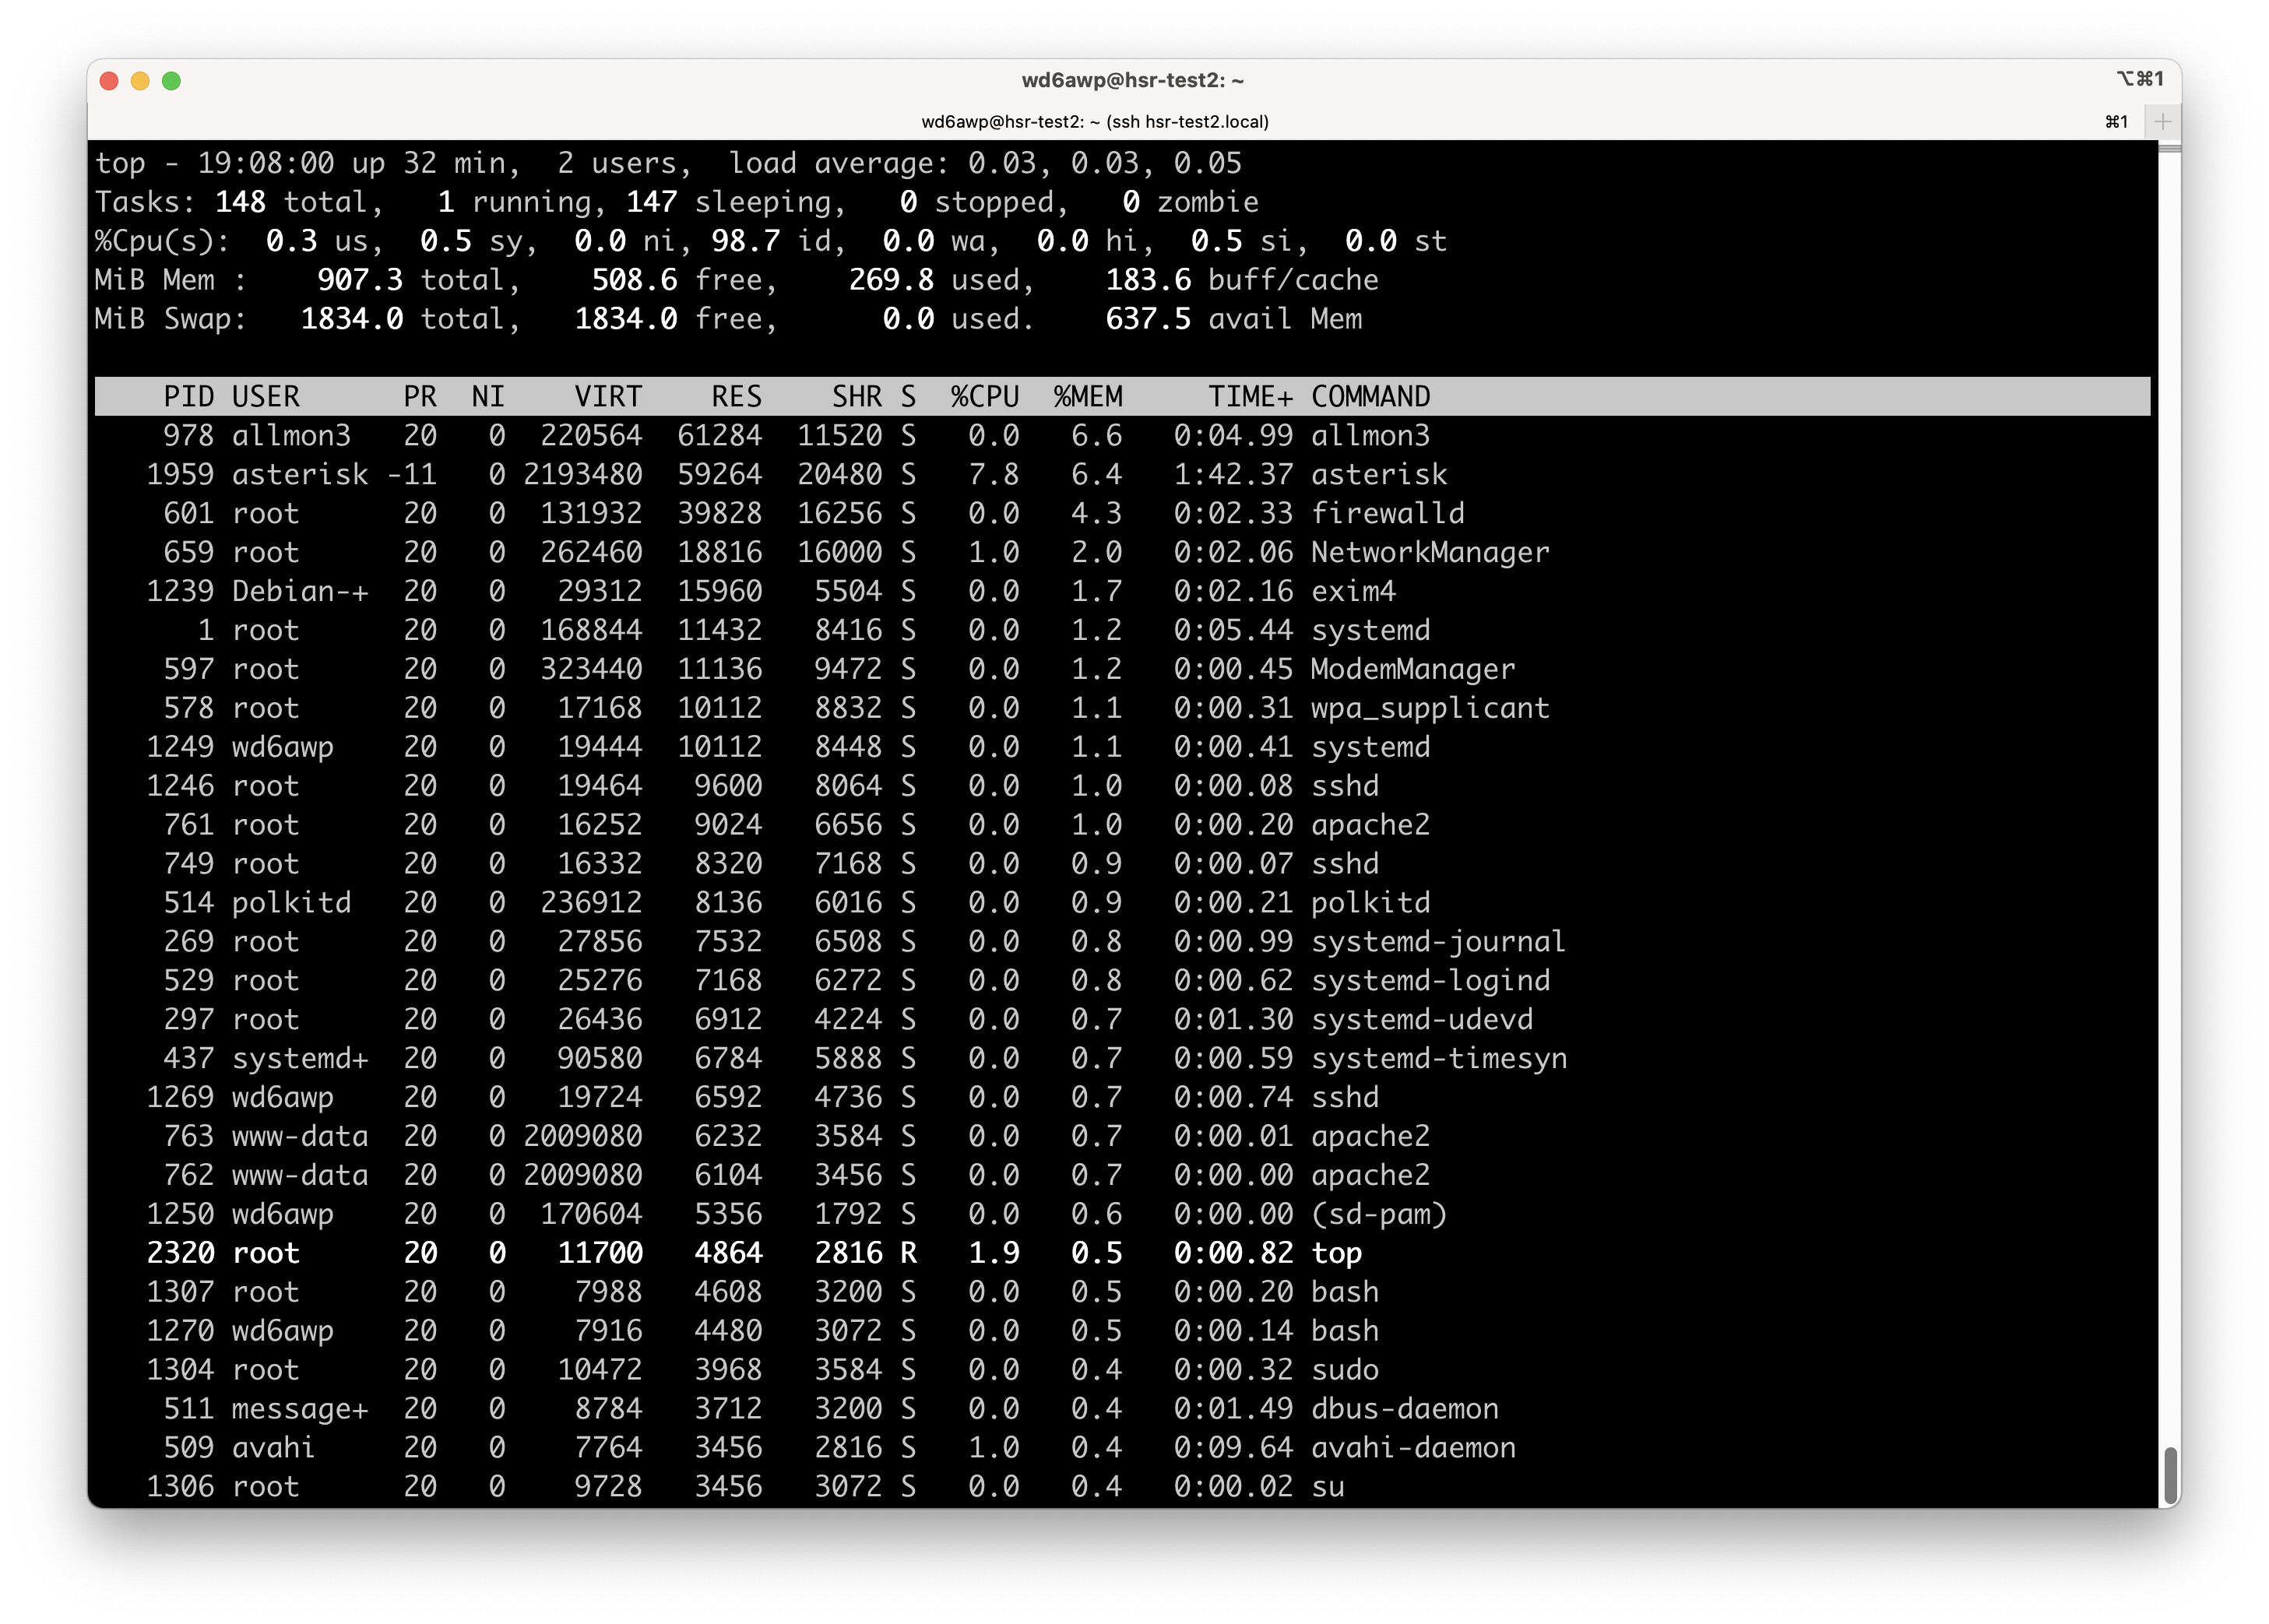
What specifically is using the memory? Can you provide the output of ‘free’ and ‘top -d1’ (sort by memory using M).
Thx, No idea how to do what you suggest. Dashboard? Metrics and history screen? Services screen? something else?
Open a terminal from Cockpit and type top -d1 and press enter. Then type a capital letter M.
You should see a crest that looks similar to this.
1 Like
Got it thank you- I will report back once the steady increasing RAM usage is confirmed w latest build.
A linux box will, in general, end up “consuming” most RAM on the system with cache. That is the ordinary course of how Linux works and is not a problem nor a “memory leak”. For example, a Linux system I happen to be logged into right now (Debian 12) has 2G of ram with 75M free. 908M is used for applications and 1.1G is currently “used” for cache. Any memory “used” by cache is immediately dumped and reallocated to a program’s use on demand.
Interesting thx. I added pics to this gallery. 62028 and 48654 are Pi4 and 44113 is a Pi3.

I will see how much more gets “used” over the next day or so.
Are cache and swap the same thing?
Having the cockpit-bridge process taking up that much RAM isn’t right. Are you leaving a Cockpit admin window open all the time, possibly showing something in Terminal? The cockpit-bridge process only runs while an active session is logged in and then is destroyed when you logout. I suppose it’s possible there’s a slow leak in Cockpit there. In general, Cockpit isn’t something left open permanently.
It seems that an issue has been filed against Cockpit for this.
I am watching my own system and it seems to be leaking over 1MB already after just 6 minutes of process time. Some of the screenshots here show process times between 3 and 26 hours, so it makes sense that if there is a leak it would get that large over that amount of time.
When I closed the portal tab that I had open in the browser, the processes died and all their memory was freed.
I opened the portal page and logged back in and new processes came in and started doing the same thing. I then dropped the admin permissions and the offending processes died.
I think the moral of the story is don’t leave your admin portal page open 24 hours a day, or if you are going to leave it open for a long time, drop the admin privileges (Click the “Administrative Access” link in the upper right of the page). If you do this you won’t have the memory problems.
1 Like
Yes I am leaving the cockpit-bridge open on these 3 nodes as they are all new and I am testing/configuring. Having anything in terminal does not seem to matter as previously at most I may have had terminal open at a static prompt. Now I do have the sys monitor output open in terminal on all 3. I did just toggle admin privs and large amounts of RAM were freed as mentioned by user encbar5. Thx all for the feedback.
You should be able to open up a terminal window and type in top or top -d1
Then you can take a screen shot of it. I also wouldn’t leave top running. I am not sure how much CPU top uses on a pi but it could take up valuable resources if you keep it running.
You should be able to open up a terminal window and type in top or top -d1 Then you can take a screen shot of it. I also wouldn’t leave top running. I am not sure how much CPU top uses on a pi but it could take up valuable resources if you keep it running.
The terminal window command and even screenshots have already been shared here Todd. Thx. Also you double posted by accident. 73
Update- Memory use by cockpit goes up in limited access mode as well w nothing running in terminal.